For all the importance we place on text, it’s an indisputable fact that images are processed in the brain faster than words. Hence the rise and rise of the infographic which, at its best, transforms complex information into graphics that are both easy to grasp and visually appealing. No wonder magazine readers and web visitors love them.
InFoto Free
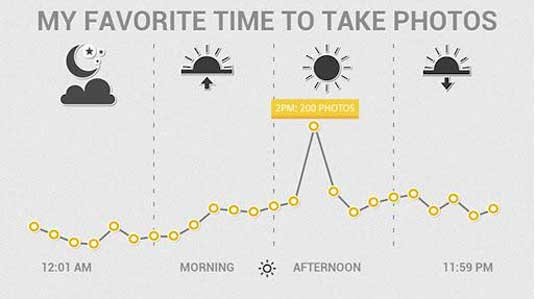
This one’s a bit niche, but if you take a lot of photos with your Android phone it’s worth checking out. InFoto takes the EXIF data attached to your photos and builds nice-looking infographics from it. It’s got a great interface, and the paid-for version (which comes without ads) only costs 99 cents.
Venngage
Venngage is a great tool for creating and publishing infographics because it’s so simple and easy to use. You can choose from templates, themes, and hundreds of charts and icons as well as uploading your own images and backgrounds, or customize a theme to suit your brand. You can animate them too!
Dipity
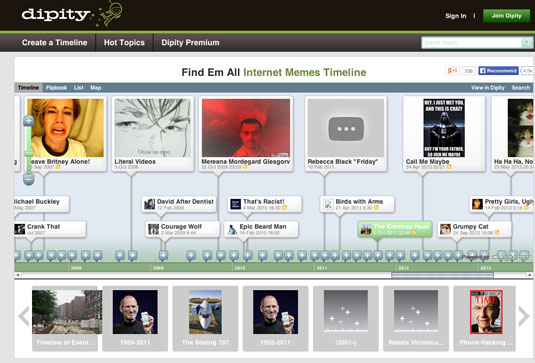
Dipity is a great way to create, share, embed, and collaborate on interactive, visually engaging timelines that integrate video, audio, images, text, links, social media, location, and time stamps. You can join for free but premium plans offer custom branding and backgrounds, analytics, and custom iPhone apps.
Get About
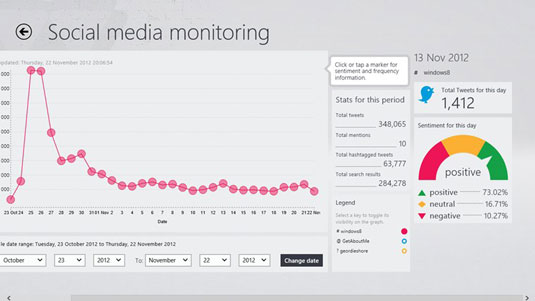
This free Windows app lets you monitor your social media activity and generate infographics that help you visualize how you connect and share with your network.
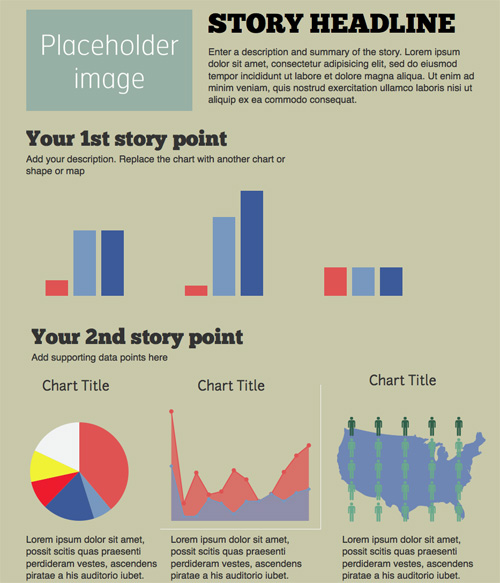
Easel.Ly
Easel.ly is a fun tool to create your Infographics with drag and drop features and a simple interface. You can easily create and share visual ideas online, supported by ‘vhemes’ or visual themes that help you get started from the preset Infograpic style. Drag and drop a ‘vheme’ onto your canvas to turn your idea into a full infographic.
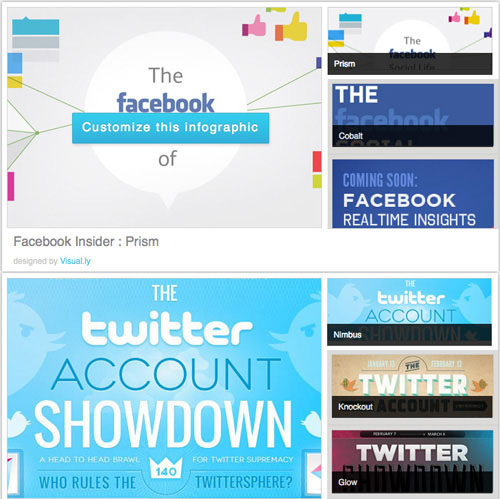
Visual.Ly
Visually helps you customize infographics in seconds, and no, you don’t have to be an analyst or designer to make infographics with Visually Create. Visual.ly allows you to also discover infographics and favorites from other users.
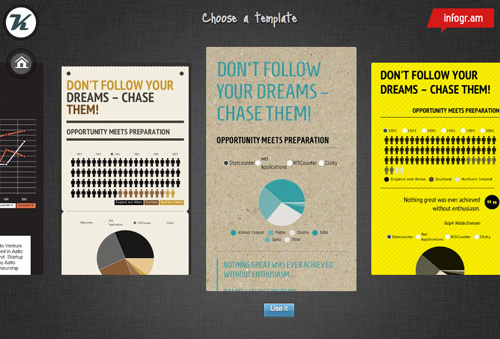
Infogr.Am
Infogr.am is a simple yet most exciting way to create static and interactive infographics. Import raw data to Infogr.am, and the site’s online tool will help you turn that data into a nice looking chart or full-blown infographic in minutes.
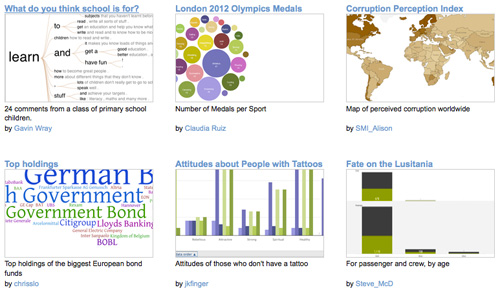
Many Eyes
Many Eyes is an experiment by IBM Research and the IBM Cognos software group with a simple belief: ‘Finding the right way to view your data is as much an art as a science’. Many Eyes provides a range of visualizations from the ordinary to the experimental, where each can be put together with a click.
Venngage
Venngage is an online infographics tool that helps you create and publish custom infographics, and at the same time, engage viewers and track results. Venngage allows you to create beautiful infographics for blogs and websites and you can also watch the numbers of your audience grow with compelling and beautiful content.
Vizualize
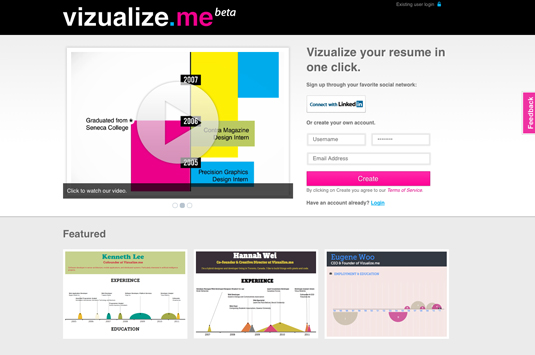
After the success of our post on an infographic résumé, it was only a matter of time before this infographic résumé generator turned up. You can visualise your resume in one click and also take a look at previous examples. Enabling people to express their professional accomplishments in a simple yet compelling personal visualisation, we think this is the start of something big.
Google Developers
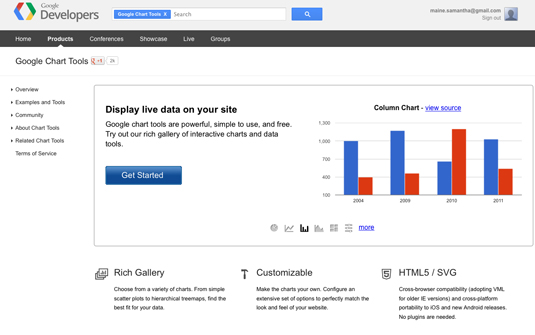
Google chart tools are powerful, simple to use, and free. You can choose from a variety of charts and configure an extensive set of options to perfectly match the look and feel of your website. By connecting your data in real time, Google Developers is the perfect infographic generator for your website.
Easel.ly
This free web-based infographic tool offers you a dozen free templates to start you off, which are easily customisable.
Piktochart
Piktochart is an infographic and presentation tool enabling you to turn boring data into engaging infographics with just a few clicks. Piktochart’s customizable editor lets you do things like modify colour schemes and fonts, insert pre-loaded graphics and upload basic shapes and images. Its grid lined templates also make it easy to align graphical elements and resize images proportionally. There’s a free version offering three basic themes, while a pro account costs $29 per month or $169 for a year.
Infogr.am
Infogr.am is a great free tool which offers access to a wide variety of graphs, charts and maps as well as the ability to upload pictures and videos to create cool infographics.

Visual.ly is a community platform for data visualization and infographics set up in 2011. It allows you both to create infographics and get them shared on social media. The website is also able to match those commissioning infographics – including brands, companies and agencies – with its community over more than 35,000 designers.